
Hello Eugene. Hello everybody.
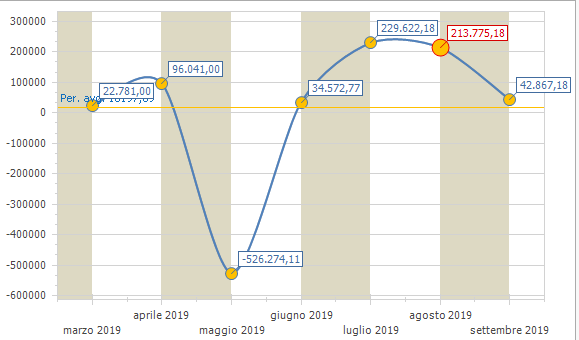
There is something I do not understand ... I have this chart in my dashboard BUT ... I do not understand why I see a -500 etc in May '19 ... I mean ... I think I did updated my data with payments from my customers ... I really do not understand.
Can You help me?
Of course I do have invoices that has not been paid yet, from august but ... Why May/June is shown there like this? Really don't know where to go and what to look for, everything seems to me ok except shit strange pistoni data!
Thank you.
Pietro
Generated Image Alt-Text
[edited by: Trados AI at 5:19 AM (GMT 0) on 5 Mar 2024]