
Pardon but ... is it possible to EXCULDE some Expense Category from the Earning Charts ???
What if I want to see incomes withous the Salary expenses, or with salaries and with no office expenses etc etc ???
Thank You.
Pietro
Pardon but ... is it possible to EXCULDE some Expense Category from the Earning Charts ???
What if I want to see incomes withous the Salary expenses, or with salaries and with no office expenses etc etc ???
Thank You.
Pietro
Hello, Pietro,
Well, first idea is to create custom QuickReport where necessary expenses will be filtered out.
However, maybe it will be good idea to add a checkbox to the Expense types data table, which will allow to exclude particular expense types from the Ledger.

Mmm ... Yes ... It sound like a very sweet idea ... BUT ... How to do that ?? :oD :oD :oDThank You.
Pietro

Well, you can go to QuickReports, copy any of them and use as a sample. Also there is pretty detailed docs:
Won't it help?
Well ... Do You think it is so easy ??? ![]()
It is not so easy ... I can not even find a checkbox ![]()
![]()
mean ... I would really REALLY love to learn how to build new toys like these. They are amazing ... But I d not have a lot of time, unfortunately ...
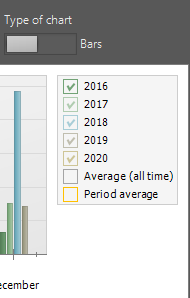
All I'd love to do is to add a checkbox in the chart You have pre-build in DASHBOARD ... As for years, so for expense type (and other types of data, maybe)
That would be easier, I suppose, If I could access the place where THIS specific chart is created, and right there find a way to add a Checkbox ...

Well ... Do You think it is so easy ??? ![]()
It is not so easy ... I can not even find a checkbox ![]()
![]()
mean ... I would really REALLY love to learn how to build new toys like these. They are amazing ... But I d not have a lot of time, unfortunately ...
All I'd love to do is to add a checkbox in the chart You have pre-build in DASHBOARD ... As for years, so for expense type (and other types of data, maybe)
That would be easier, I suppose, If I could access the place where THIS specific chart is created, and right there find a way to add a Checkbox ...
Hello, Pietro,
Sure, as designer is suitable for solving a lot of task, it's flexible, but requires some learning.
Checkbox can be added like this:
1. Create new QuickReport, and use Ledger table as data source.
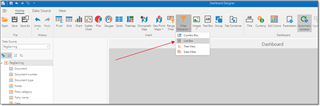
2. In an empty designer, add Filter elements > List box:
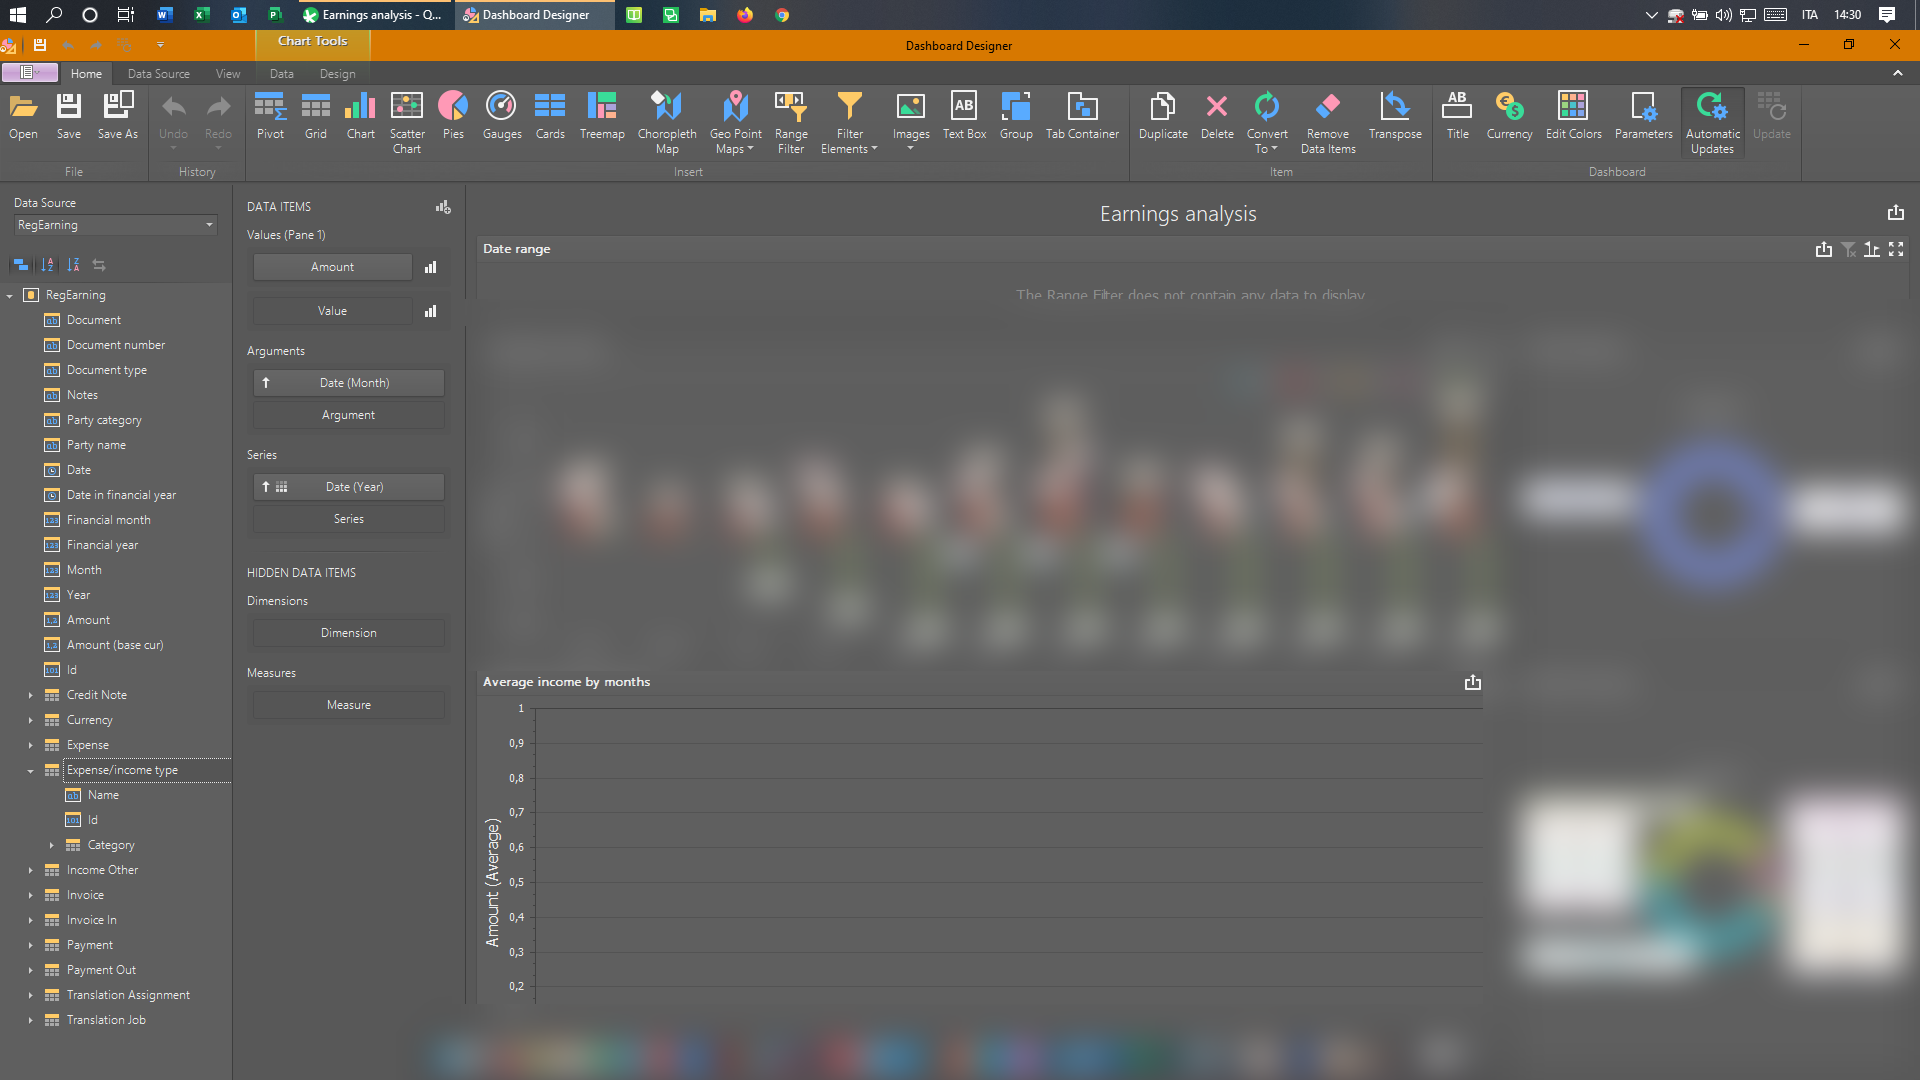
3. Drag and drop Expense/income type.Name field from field list to the Dimension parameter:
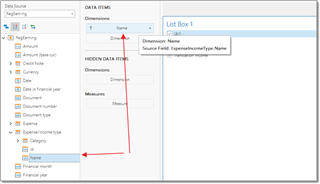
List box will be immediately filled with list of expense type you have.
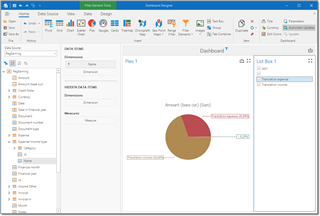
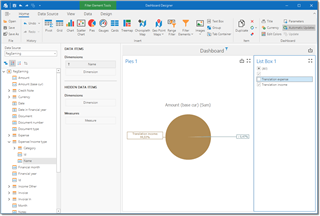
4. Add, for example, some chart to the designer. Let it be Pie chart. For value, drag Amount (base currency), and for Dimension select the same Expense/income type.Name field. You will see overall totals per each expense type. Deselect any expense type in the filter list, and pie chart will be immediately updated:
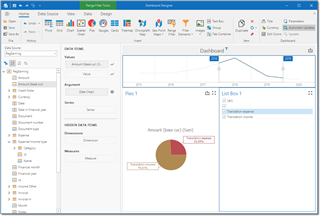
5. Add Range filter to the report, and select Amount (base currency) as a value and Date as an argument. From now, you quickly filter data in the report by date:
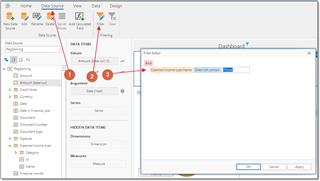
6. To always disable certain expense types from this chart, select Data source tab on the ribbon and click Filter button. In the filter editor, specify filter which you want to always be applied to this report, regardless selections made in the date range filter and list box filter.