

Hello Eugène,
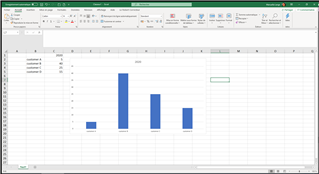
Despite an extensive search in the wiki, I can not manage to create a simple graphic report. What I would like is a bar chart with the turnover per customer in current year.
Would you have a step by step approach or a mini video showing how to do that. About the videos, note that a lot of videos are based on Baccs 3.x which is sometimes confusing. But they are very helpful.
Under is what I want to create in TBM:
Thanks in advance.
Generated Image Alt-Text
[edited by: Trados AI at 5:38 AM (GMT 0) on 5 Mar 2024]


